How do you explain what reelyActive does? Early in our history, we discovered that describing our platform as “Google Analytics for the Physical World” resonated well with those who were familiar with Google’s tool, typically used for understanding and optimising website traffic.
Exactly two years ago, motivated and inspired from our success at the Startup World Finals, we asked ourselves: why don’t we literally create Google Analytics for the physical world? In other words, why not directly connect our real-time location platform with the tool?
Exactly one year ago, once our open source software stack was sufficiently advanced, we finally did it. Turns out it only required a few trivial lines of code!
Now that we’ve collected nearly a year’s worth of data from Notman House and pilot projects at two local cafés, let’s see how Google Analytics for the Physical World is working out.
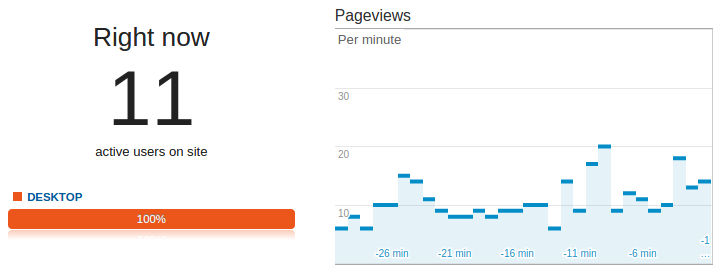
A real-time view in the tool’s dashboard shows the current number of visitors of a website. In our case, it shows how many unique devices (smartphones, wearables, etc.) are emitting Bluetooth Smart packets detected by our sensors. The image below shows 11 detected visitors at both cafés at 7h30 in the morning.
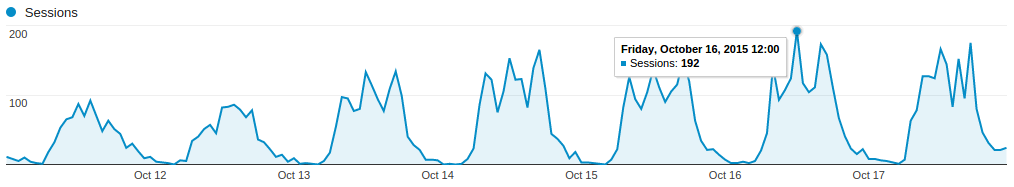
But it’s in the session histories that we start to identify interesting events that would allow for actionable intelligence. Take for instance a week of “session” data from the cafés. We clearly see Sunday and Saturday on the bookends as having unstructured attendance. However, from Monday to Friday we can easily identify the breakfast, lunch and dinner peaks.
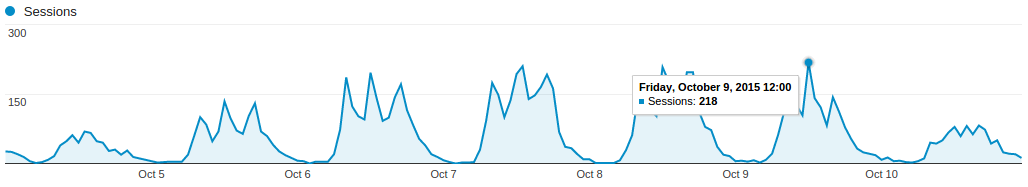
Now let’s look at the following week. What happened on Monday? Oh right, that was Canadian Thanksgiving (which we celebrate on a Monday, a month earlier than our American friends, eh?). In both cases we see that Friday lunch appears to be peak business, and that can be compared with the Point-of-Sale records and anecdotal evidence from the staff.
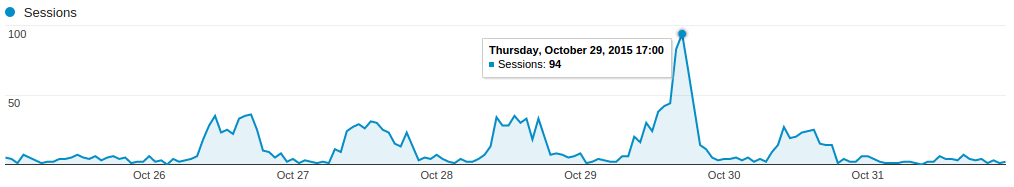
How about a different venue such as the startup accelerator at Notman House where we proposed on our first day, three years ago, that walking into a space would be like logging into that space? Well, here’s last week’s session data. What’s that spike on Thursday October 29th at 17h? It’s Startup Open House which attracted plenty of visitors.
Finally, a visualisation to show visitor flow, or, in the physical world, customer journey mapping. Each cafe has two sensors, one near the POS, the other near the dining area. Here we see which sensor is more likely to detect the visitor’s device first, and then the progression between the two sensors. The red drop-offs from the starting “page” are equivalent to a bounce, or a passing visitor. Progressions in the customer journey are representative of conversions: the visitor entered the café for some time.
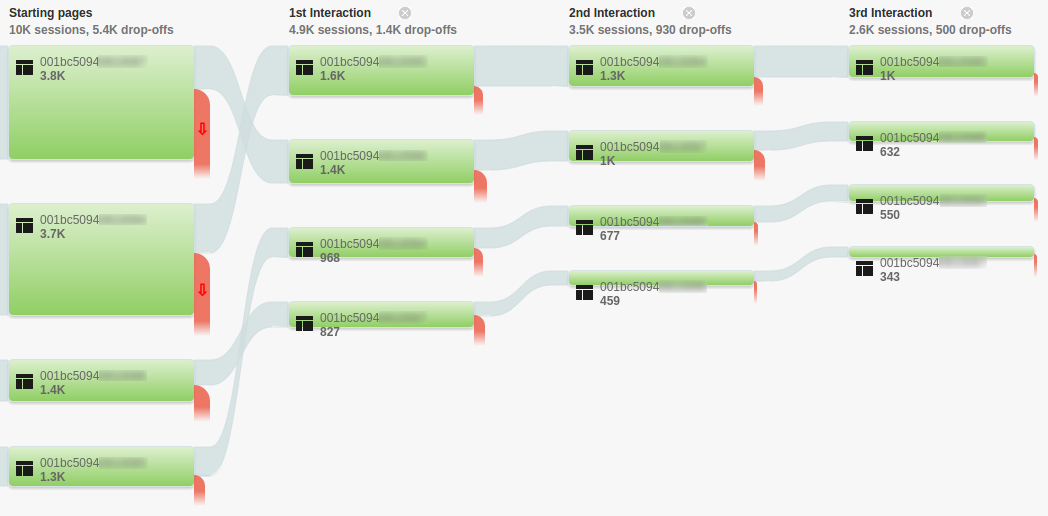
An astute observer will notice that there are never any journeys from one café location to the other. This is because the session would expire before the visitor had time to make it from one to the other. Nonetheless, tools such as Web Road 66, created by our partners in the café deployments, are able to identify and analyse such cross-location visits which represent significant value for chains and franchises.
Google Analytics for the Physical World is indeed a hit (pun intended), even with its limitations. For an SME that already uses the tool for their website, what a simple progression to use it for physical presence via the seamless integration with the reelyActive platform. All we need is your Analytics Account ID to start streaming the real-time data from our servers, and, chances are, the traffic will fit within the limits of the tool’s free tier!
The next time you enter a space, look down and imagine the floor as a giant webpage and your feet as the cursor. Fear not, you’re browsing incognito! Soon though, we trust you’ll find a comfortable incentive to opt-in: our mission, after all, is to unlock the value of the data you choose to share.

Comments
2 responses to “Google Analytics for the Physical World”
[…] (GA) timeline for Notman House. Our platform pushes all the events from the house to GA (see our Google Analytics for the Physical World blog post), where each is interpreted as a session based on its identifier. The Nearables’ […]
LikeLike
[…] Several companies have self-identified as such. We ourselves have written a blog post entitled Google Analytics for the Physical World. But what happens when you literally run real-world behaviour data through tools designed for the […]
LikeLike